Aodhan Sweeney-Jaramillo
Graduate Student at the University of Washington
Degree: Atmospheric Sciences and Data Science
NASA FINESST Fellow
email: aodhan@uw.edu

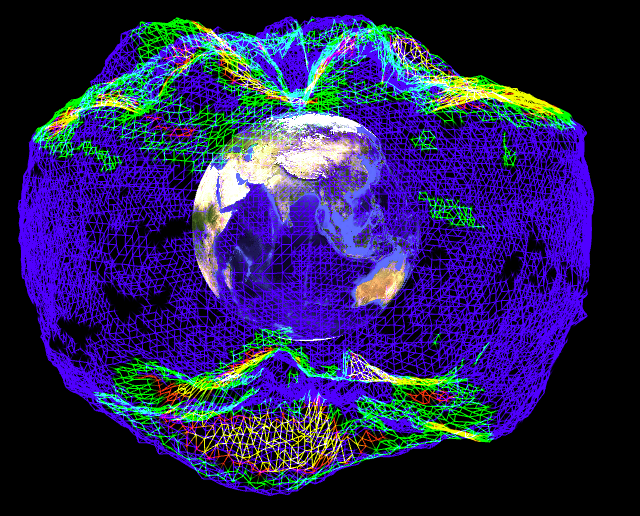
The interactive globe on the left shows a loop of the mean seasonal cycle of surface temepratures from the Atmospheric Infrared Sounder (AIRs) instrument onboard NASA's AQUA satellite from 2002-2021.
Publications
[8] Sweeney, A., Fu, Q., Po-Chedley, S., Solomon, S., Randel, W., Steiner, A., Wallace, J., Lin, P., Birner, T., 2024 The Warming of the Southern Hemisphere Subtropical Lower Stratosphere and Implications for Detecting Antarctic Ozone Recovery In Preparations.
[7] Huo, Y., Wang, H., Veneziani, M., Comeau, D., Osinski, R., Hillman, B., Roesler, E., Maslowski, W., Rasch, P.J., Weijer., W, Baxter, I., Fu, Q., Oluwayemi G.A., Ma, W., Seefeldt, M.W., Sweeney, A., Wu, M., Zhang, J., Zhang, X., Zhang, Y.,, Asay-Davis, X., Craig, A.P., Lee, Y.J., Zhang, S. (2024). E3SM-Arctic: Regionally Refined Coupled Model for Advanced Understanding of Arctic Systems Interactions. Submitted to Journal of Advnaces in Modeling Earth’s Systems.
[6] Sweeney, A., Fu, Q., Po-Chedley, S., Wang, H., Wang, M., 2024 Unique Temperature Trend Pattern Associated with Internally Driven Global Cooling and Arctic Warming during 1980-2022 Geophysical Research Letters, 51, e2024GL108798, doi:10.1029/2024GL108798.
[5] Sweeney, A., Fu, Q., 2024 Interannual Variability of Zonal Mean Temperature, Water Vapor, and Clouds in the Tropical Tropopause Layer J. Geophys. Res. Atmos., 129, e2023JD039002, doi:10.1029/2023JD039002.
[4] Wang, M., Fu, Q., Hall, A., Sweeney, A., 2023 Stratosphere-Troposphere Exchanges of Air Mass and Ozone Concentrations from ERA5 and MERRA2: Annual-Mean Climatology, Seasonal Cycle, and Interannual Variability. J. Geophys. Res. Atmos., 128, e2023JD039270, doi:10.1029/2023JD039270.
[3] Sweeney, A., Fu, Q., Po-Chedley S., Wang, H., Wang, M., 2023 Internal variability increased Arctic amplification during 1980–2022. Geophysical Research Letters, 50, e2023GL106060, doi:10.1029/2023GL106060.
[2] Sweeney, A., Q. Fu, H. A. Pahlavan, and P. Haynes, 2023: Seasonality of the QBO Impact on Equatorial Clouds. J. Geophys. Res. Atmos., 128, e2022JD037737, doi:10.1029/2022JD037737.
[1] Sweeney, A. J., and Q. Fu, 2021: Diurnal Cycles of Synthetic Microwave Sounding Lower-Stratospheric Temperatures from Radio Occultation Observations, Reanalysis, and Model Simulations. J. Atmos. Oceanic Technol., 38(12), 2045-2059, doi:10.1175/JTECH-D-21-0071.1.
Research
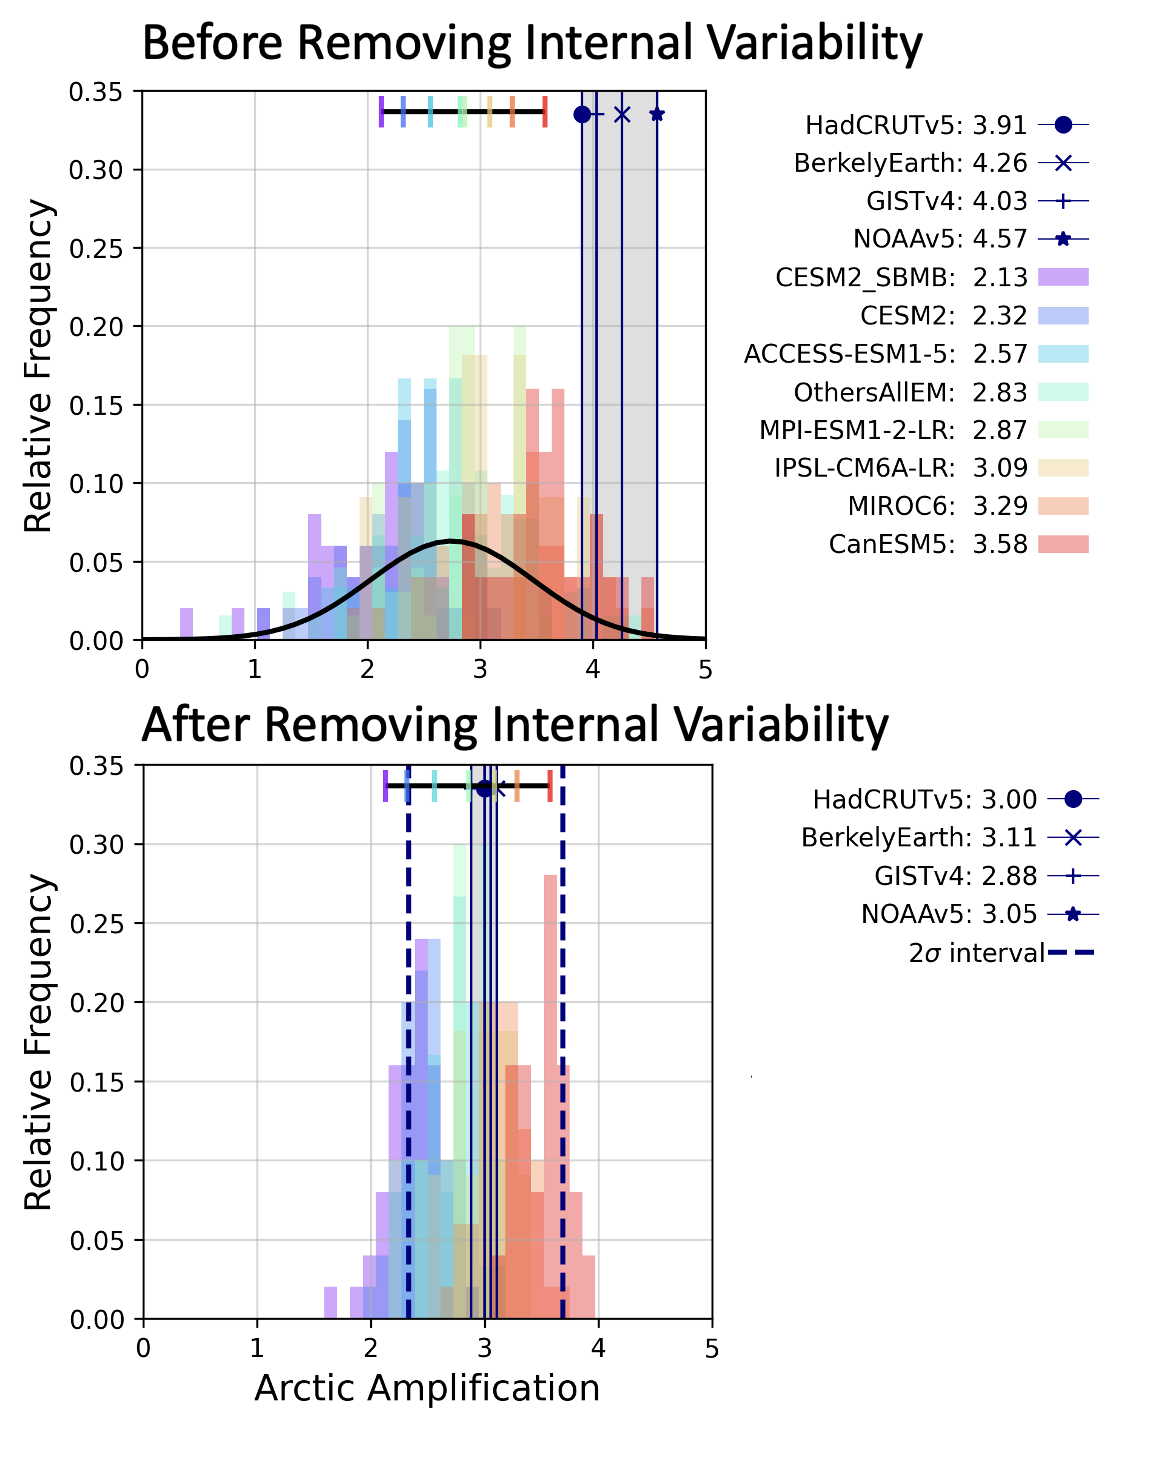
Quantifying the Role of Internal Variability with Neural Networks
Observed changes in the Earth's climate system may be due to increasing greenhouse gases, internal climate variability, or both. We use simple neural networks to separate the relative importance of these sources. The figure on the right shows an example of this applied to Arctic Amplification (AA). It was found that while observed AA is 4.2 (shown in grey in top panel) from 1980-2022, after accounting for internal variability, this factor is closer to 3.0.
The GRL paper can be found here.
The code for the project can be found on github.
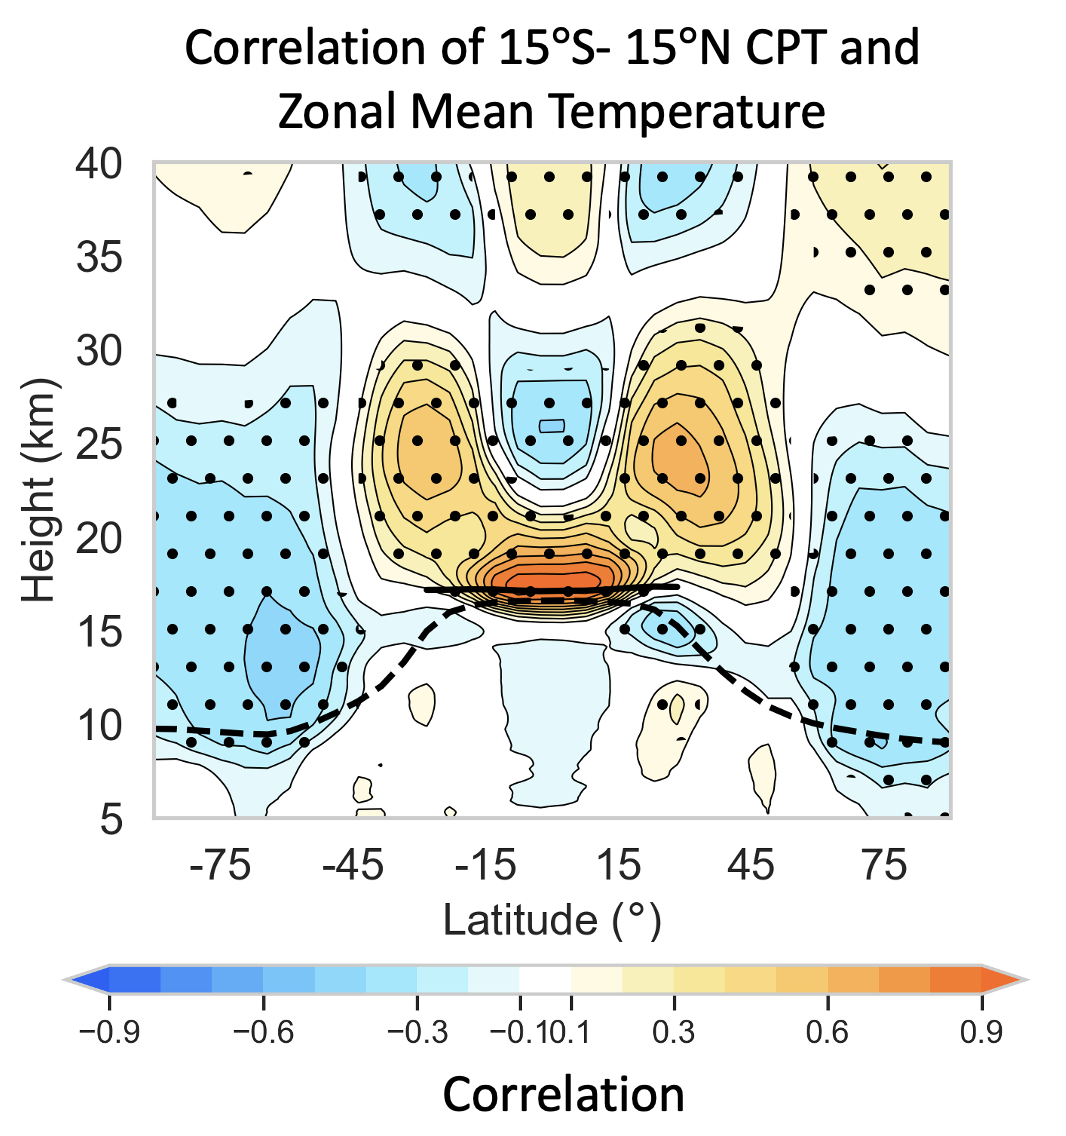
Variability of the Tropical Tropopause Layer (TTL)
The boundary between the tropical troposphere and the stratosphere is referred to as the tropical tropopause Layer (TTL). The TTL region is important because it constrains the composition of the global stratosphere, and is difficult to model because it is sensitive many different time and spatial scales. The figure on the left shows the correlation between the interannual variability in cold point tropopause temperature (CPT) and the zonal mean temperature in the troposphere and stratosphere. The cold point tropopause temperature is generally more correlated to the stratosphere, posing interesting questions regarding the role of the stratosphere in determining the variability of this region.
My work has studied the interannual variability of this region, focusing on the role of large-scale modes of variability. We found that the Quasi-Biennial Oscillation, is a strong control on clouds in the TTL, and can even impact the radiation budget of the tropics through it's control on these clouds. The paper is published in JGR Atmosphere can be found here. The code for the project can be found on github
I have also investigated the sensitivity of temperature, water vapor, and clouds in this region. The preprint for this project can be found here. The code for the project can be found on github.
For my Masters thesis, I documented the diurnal cycles in this region. This arcticle is published in the Journal of Oceanic and Atmospheric Technology. The code for the project can be found on github.
Miscellaneous
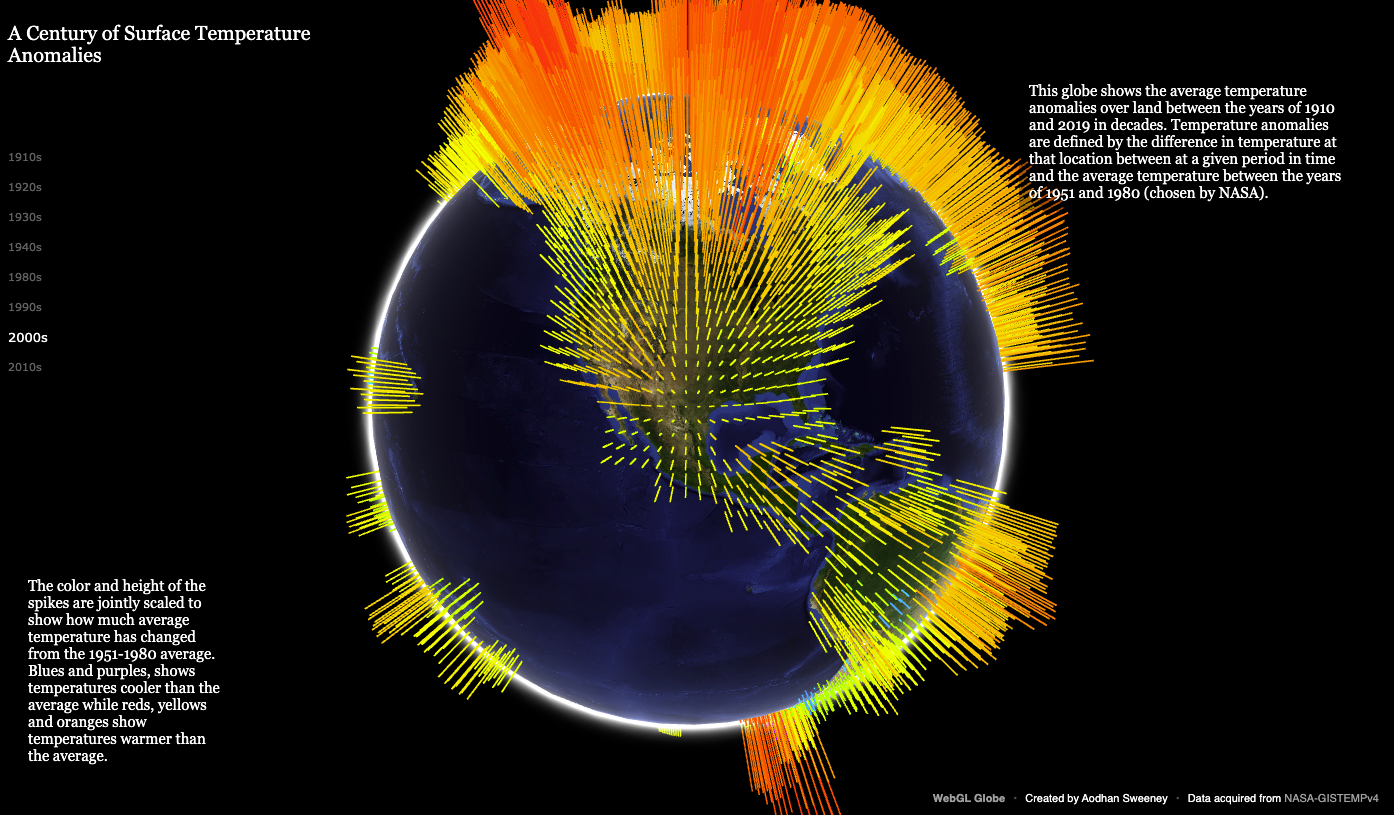
Climate Change Visualization Chrome Experiment
This interactive javascript visualization helps show changes in surface temperature over land during the last century. This project is featured as a Google Chrome Experiment and can be found here.
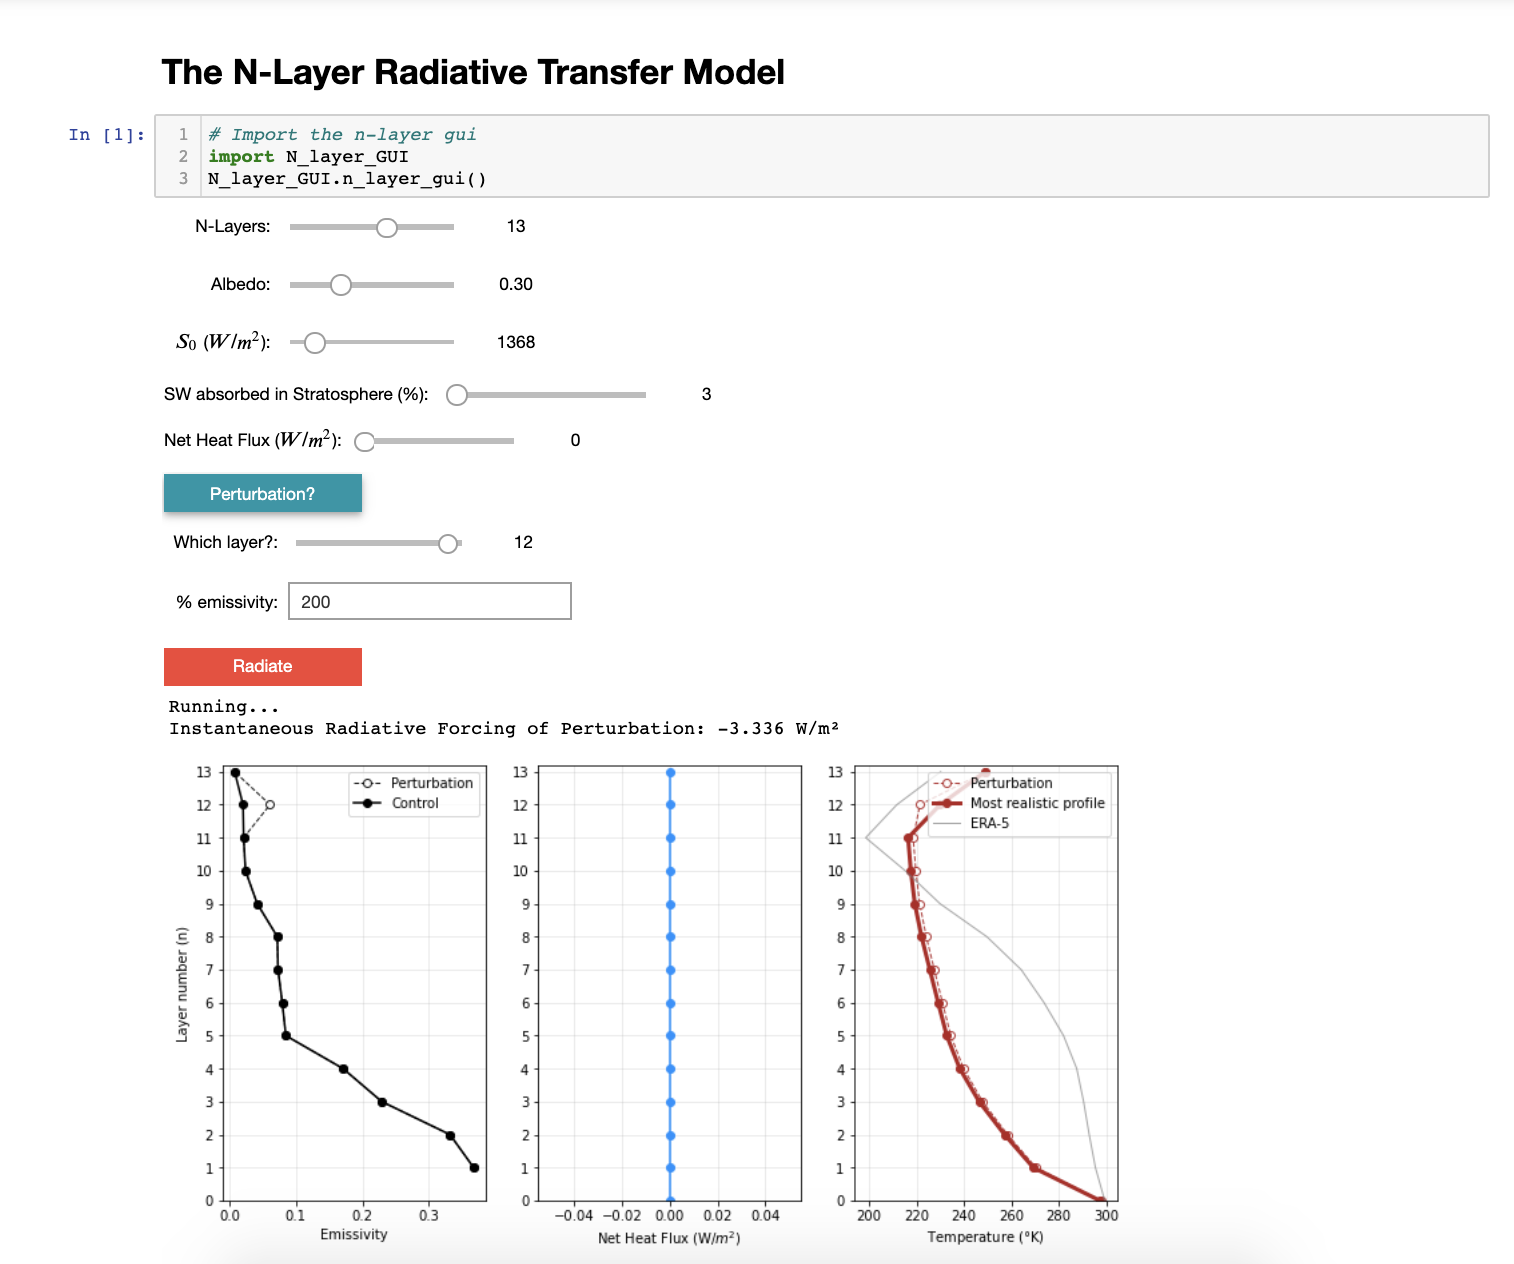
N-Layer Radiative Transfer Model
For a class project, Vince Cooper (graduate student at UW) and I scaled up the toy 1- and 2-layer atmosphere models, to a more general N-layer model. This tool allows you to perturb the radiation at any given level, allowing for a physical interpretations of why the mean atmospheric temperature profile looks the way it does. The code for this project is available here.
Visualization of Polar Vortex
The polar vortex destruction in early 2019 led to anomalously cold temperatures over North America impacting millions. This visualization shows how the vortex evolved by using 500 hPa geopotential height manifolds rendered over the Earth’s surface. This visualization won runner-up at AGU's 2019 Data Visualization & Story Telling Contest, and can be viewed here.